Counting PCR: A new method to obtain absolute DNA copy number without a standard curve
John SantaLucia, Jr. and Gregory J. Boggy
DNA Software, Inc., Ann Arbor MI 48104
Abstract
DNA Software has discovered how to analyze the shape of a PCR curve to reveal the absolute copy number of DNA at cycle zero. This discovery has led to the development of a method for absolute DNA quantification called Counting PCR (cPCR). In cPCR, each copy of DNA is literally counted for each cycle of PCR, the results of which are absolute DNA copy numbers. Because these results are instrument and fluorophore independent, qPCR results from different laboratories can be compared and metaanalysis studies of archived data sets can be performed.
DNA Software has incorporated the principles of cPCR in to qPCR CopyCount, which is a cloud-based service that automatically analyzes quantitative PCR (qPCR) data to derive the absolute DNA copy number of all qPCR reactions without the need for a standard curve.
qPCR CopyCount has been rigorously validated on more than one hundred thousand samples. The high quality of absolute quantification from qPCR CopyCount can be used for a variety of applications such as mRNA gene expression analysis, viral load, genotyping copy number variation, seed zygocity testing, next generation sequencing fragment libraries, and non-invasive detection methods.
qPCR CopyCount is available as an online service at http://portal.dnasoftware.com.
qPCR CopyCount
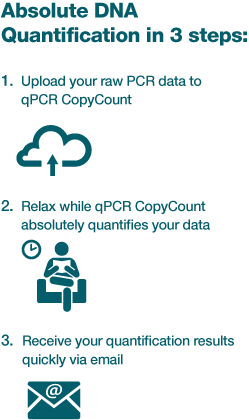
Figure 1: qPCR CopyCount workflow.
qPCR CopyCount is a cloud-based service that automatically analyzes qPCR data to derive the absolute DNA copy number of all qPCR reactions without the need to run a standard curve. qPCR CopyCount builds upon the mechanism-based fitting method described by Boggy and Woolf called MAK2 (Mass Action Kinetic model with 2 parameters).1
The two parameters of MAK2 are the DNA concentration at cycle zero, D0, and the parameter, k, which rigorously accounts for the cycle-by-cycle changes in amplification efficiency. MAK2 was previously limited to providing only relative quantification of the same target in different samples.
DNA Software has built upon the foundation of MAK2 and greatly enhanced it to create qPCR CopyCount, which provides completely automated curve fitting for all major PCR instruments, performs thorough error analysis, has 3-fold better accuracy than MAK2, and greatly improves the reliability of DNA quantification. Most importantly, DNA Software has extended the capabilities of qPCR CopyCount to include cPCR so that absolute quantification without standards is now possible for all qPCR reactions. Figure 1 shows the simple workflow for qPCR CopyCount. A user collects the needed qPCR data and uploads the data to the cloud-based service. qPCR
CopyCountthen carries out the analysis, which includes the following:
- Determining the range of data points that are to be analyzed.
- Determining which qPCR wells have a true sample versus noise.
- Carrying out replicate averaging, outlier detection, and statistical error analysis.
The absolute DNA copy number results are provided to the user in a .csv file that can be opened in Excel or a text editor. A separate analysis file is also provided that details the replicate averaging, outlier detection, and statistical analyses that were carried out.
Counting PCR
Counting PCR (cPCR ) is a method developed by DNA Software for absolute DNA quantification. The basic idea of cPCR is to determine the fluorescence from a single copy of DNA and to use this value to determine the number of copies of DNA in an unknown from its fluorescence at cycle zeroA single qPCR well is sufficient to carry out the analysis.
Consider a simple analogy of counting the number of apples in a basket. You can accomplish this by weighing all the apples in the basket, subtracting the weight of the basket, and then dividing by the weight of one apple.
Similarly, we can count the number of copies of DNA in a sample by measuring the fluorescence of all the copies of DNA (after subtracting the background) and then dividing by the fluorescence of a single copy of DNA. At a typical target DNA concentration, (i.e. <1 million copies per nL), the amount of fluorescence from DNA is much smaller than the background fluorescence. As we result, we cannot directly measure the fluorescence of all the copies of DNA or the fluorescence from a single copy. We can, however, use qPCR to amplify the fluorescence signal in a predictable fashion, and then use the modeling found in qPCR CopyCount to analyze the high signal to noise “bend” in the qPCR curve (Figure 2) to deduce the number of copies of DNA that are present in an unknown at cycle zero.
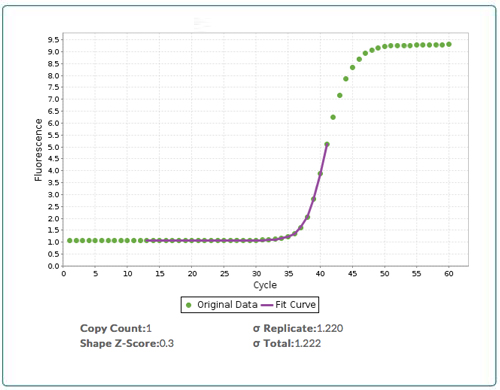
Figure 2: Output from qPCR CopyCount. Raw qPCR data (green boxes) with the fit (purple line) from qPCR CopyCount for a target that has a DNA copy number = 1 at cycle zero (D0). qPCR CopyCount fits the data in the “bend” of the curve.
For optimal results, the fluorescence from a single copy can be determined experimentally by a simple one-time, assay-specific calibration that applies to all instruments and samples and that does not require any standards. In such a calibration, the fluorescence is measured for a single plate of a sample, with the sample diluted to an average of approximately 1.5 copies per well (see Calibration Plate Protocol for more details). For a 384 well plate, this procedure provides a calibration error of lower than 5% for absolute quantification.
If there are no changes in primer design, primer concentration or the master mix, then this assay calibration is sufficient for all future samples. Once such calibration is performed for an assay, then for a single well qPCR CopyCount provides the absolute DNA copy number with a standard error of lower than 5% for absolute calibration.
Absolute Quantification Accuracy
Some applications, such as gene expression analysis, require that the relative amount of two genes is compared, but do not require high absolute accuracy. For these applications, qPCR CopyCount can predict the single-copy fluorescence without any calibration, resulting in an absolute quantification accuracy of approximately 20% and a relative quantification accuracy of 1-5% for a single well and a lower error if replicates are performed.
Table 1 compares the features in cPCR to the features in three other DNA quantification methods -Digital PCR, Standard Curve, and Delta CT.
| Feature | cPCR | Digital PCR | Standard Curve | Delta CT Method |
|---|---|---|---|---|
| Relative Quantification | ✓ | ✓ | ✓ | ✓ |
| Absolute Quantification | ✓ | ✓ | ✓ | |
| No Standards | ✓ | ✓ | ||
| Not Corrupted by low efficiency | ✓ | ✓ | ||
| No Gene Normalization | ✓ | ✓ | ||
| Error Analysis included | ✓ | ✓ | ||
| No specialized equipment | ✓ | ✓ | ✓ | |
| High throughput | ✓ | ✓ | ||
| Low Replicates | ✓ | ✓ | ✓ | |
| No Dilution Series | ✔ |
Table 1: Feature comparison for cPCR versus Digital PCR, Standard Curve, and Delta CTmethods.
Because cPCR uses standard qPCR instrumentation and requires a far fewer number of replicates, cPCR has higher throughput than digital PCR. Also, unlike digital PCR, cPCR works with native samples without the need for sample dilution, which simplifies sample preparation.
No Special Equipment Needed
Moreover, cPCR does not require any special equipment. As a result, you can quickly incorporate cPCR into your existing analysis pipeline with minimal changes in your protocols and you can use cPCR to carry out meta-analysis studies of archived data sets. Unlike the Standard Curve method and the Delta CT method, cPCR does not require standards, dilution series, elaborate gene normalizations, or corrections for different PCR efficiencies.
Thorough Error Analysis
Finally, cPCR includes thorough error analysis, which is useful interpreting data in situations where the qPCR data are unreliable because of poor data acquisition or poor primer design.
Table 2 summarizes some of the applications that are suitable for cPCR analysis as compared to digital PCR. Because cPCR has a much higher throughput than digital, cPCR is appropriate for applications that require high-throughput such as viral load, fragment library quantification for next generation sequencing, and non-invasive detection methods.
| Application | cPCR | Digital PCR |
|---|---|---|
| High-throughput Viral Titer | ✓ | |
| NGS: Fragment Library Quantification | ✓ | |
| Non-invasive Detection Methods | ✓ | ✓ |
| Copy Number Variation | ✓ | ✓ |
| Meta Analysis of Archived Data Sets | ✓ |
Table 2: Comparison of scientific applications of cPCR vs. Digital PCR.
Case Study: GAPDH Dilution Series
Figure 3 illustrates the power of qPCR CopyCount with a single housekeeping gene, GAPDH (glyceraldehyde phosphate dehydrogenase). These experiments were performed at Fluidigm Corporation using their BioMark™ HD System with the Dynamic Array™ IFC 96×96 chip capable of 9216 simultaneous 6.7 nL PCR reactions. A series of 72 replicates of 15 dilutions (3-fold dilution each) were performed for a total of 1080 qPCR reactions on the chip.
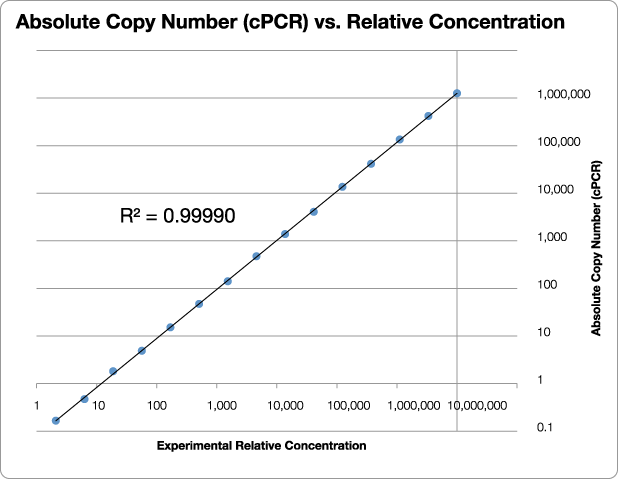
Figure 3: Results from a blind test of qPCR CopyCount vs. the experimental relative concentration for GAPDH. Note the outstanding linearity (R2 = 0.99990) over more than 4 million fold range in concentration. Data provided courtesy of Dr. Gang Sun, Fluidigm Corporation.
Conclusion
Counting PCR (cPCR) is a quantum leap forward in our understanding of qPCR. The principle of cPCR has been incorporated into the revolutionary software product qPCR CopyCount, which provides highly reliable absolute qPCR quantification. qPCR CopyCount saves you money – you can use your existing qPCR instruments (no special equipment is required), and it requires a far fewer number of replicates than digital PCR. More of your plate real estate can be used for samples rather than controls and standards.
Copycount Saves Time
qPCR CopyCount saves you time – you get your results faster because of the high throughput of cPCR and because cPCR requires no dilution series or laborious preparation of quantification standards.
Finally, qPCR CopyCount saves you effort – your bottleneck in qPCR analysis will be reduced dramatically because you will no longer have to carry out intensive manual calculations to correct for differences in PCR efficiency, performing complex gene normalization, and to correct for the effects of PCR data acquired with different instruments, PCR buffers, and protocols.
The absolute quantification from qPCR CopyCount allows for easy comparison of results from different samples, different targets, and different laboratories. This breakthrough in understanding the mechanism of qPCR will have significant implications for DNA-based applications.
1Patent pending. Boggy, G. J. & Woolf, P.J. (2010). “A mechanistic model of PCR for accurate quantification of quantitative PCR data.” PLoS ONE5(8): 355.