Quick Guide to the Precision and Accuracy of results from qPCR CopyCount
Purpose: This Quick Guide to the Output provides you with the basic description of QRT PCR data analysis and how to interpret the output results from qPCR CopyCount.
Summary: An understanding of the difference between precision and accuracy is critical to interpreting the results from qPCR CopyCount. The three most important metrics to understand are σRelative, σCalibration, and σAbsolute. Respectively, these three metrics correspond to the precision (i.e. for relative quantification), the systematic error, and accuracy (i.e. for absolute quantification) of the DNA copy count.
Introduction to Accuracy vs. Precision:
To illustrate the fundamental difference between accuracy and precision, the analogy to a shooting target is instructive (Figure 1). The far left panel of Figure 1 shows the case of a rifle with calibrated sighting scope in the hands of a professional marksman with a steady hand. The middle left panel is the result for a professional marksman using a rifle whose sighting scope is not calibrated. The middle right panel is the result for an amateur (with a shaky hand) using a calibrated rifle. The far right panel is for an amateur shooting an un-calibrated rifle.
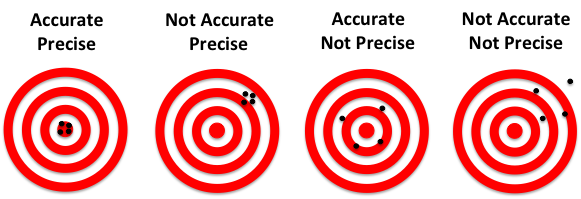
Figure 1: Illustration of accuracy vs. precision using a shooting target.
In this analogy, each shot of the rifle corresponds to a single qPCR reaction. The σRelative is a measure of precision or random error. σCalibration is a measure of the systematic error or accuracy. The σAbsolute is the total error that results from both σRelative and σCailbration. Factors that contribute to σRelative include the Poisson sampling error (described below), pipetting errors in the amounts of target and other reagents, and noise in the qPCR data. Averaging the replicates reduces the random error and results in a smaller σRelative., which represents the standard error of the mean for the replicate set. The more replicates that are performed, the smaller theσRelative. The σCalibration can be improved by performing a calibration plate with more replicates and using the proper mean copy number.
Best Practices:
- For your samples (i.e. unknowns), perform as many replicates as possible to decrease the relative error.
- Calibrate your pipettes and use good pipetting technique to reduce the random and systematic errors (improves both relative and absolute quantification).
- Performing a calibration plate with as many replicates as possible is highly recommended. Keep in mind that the calibration plate only needs to be performed once for each assay design and is instrument and sample independent and never needs to be repeated. Thus it is best to perform many replicates for the calibration plate and then all subsequent Copy Counts will have the highest possible accuracy.Note: If you do not perform a calibration plate, then the copy count results are still highly precise and thus reliable for relative quantification, but the absolute quantification inaccuracy will be within 20-30%, and in rare circumstances could be substantially larger than this.
Basic Error Analysis:
About replicates.
Performing replicate PCR experiments allows the calculation of the standard deviation among those replicates:
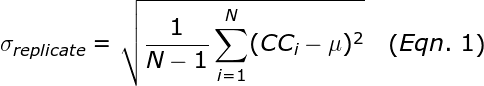
where N is the number of replicates, μ is the average copy count of the replicates, and CCi is the copy count number for well i. The σReplicate represents the expected error for a single qPCR well. The Poisson sampling error is given by the square root of the copy count. Thus, if the mean copy count is small (less than 400 copies), then the Poisson sampling error is the dominant contribution to the σReplicate. Such Poisson error occurs even if the user pipettes perfectly.
The average or mean, is significantly more reliable than a single measurement. The standard error in the mean, σMean (also called σRelative), is given by:
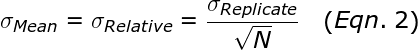
Thus, performing more replicates can dramatically reduce the error in the mean (i.e. σRelative). For example, performing 16 replicates results in 4-fold smaller error than a single qPCR reaction.
The coefficient of variation, CV, is the ratio of the error divided by the mean. Thus, the CVRelativeis given by:
![]()
The absolute error is the combination of the relative error and the calibration error as follows:
![]()
Table 1 illustrates the effects of different combinations of calibration and relative errors. Note the absolute errors are dramatically smaller for calibrated assays than for uncalibrated assays.
| Case | CVCalibration | CVRelative | CVAbsolute |
|---|---|---|---|
| Accurate & Precise | 0.03 | 0.01 | 0.032 |
| Inaccurate & Precise | 0.20 | 0.01 | 0.200 |
| Accurate & Imprecise | 0.03 | 0.04 | 0.050 |
| Inaccurate & Imprecise | 0.20 | 0.04 | 0.204 |
Table 1: Effect of different Calibration and Relative errors on Absolute Error from Eqn 4.
Notes: Errors shown are typical for if the calibration plate has 384 wells (i.e. CVCalibration = 3%) and 16 replicates (CVRelative = 1%) are performed on the unknowns. Assays that are uncalibrated are assumed to have 20% calibration error. A sample with only a single replicate (imprecise) are assumed to have 4% relative error.