Category: CopyCount
Quick Guide to the Precision and Accuracy of results from qPCR CopyCount
Purpose: This Quick Guide to the Output provides you with the basic description of QRT PCR data analysis and how to interpret the output results from qPCR CopyCount.
Summary: An understanding of the difference between precision and accuracy is critical to interpreting the results from qPCR CopyCount. The three most important metrics to understand are σRelative, σCalibration, and σAbsolute. Respectively, these three metrics correspond to the precision (i.e. for relative quantification), the systematic error, and accuracy (i.e. for absolute quantification) of the DNA copy count.
Introduction to Accuracy vs. Precision:
To illustrate the fundamental difference between accuracy and precision, the analogy to a shooting target is instructive (Figure 1). The far left panel of Figure 1 shows the case of a rifle with calibrated sighting scope in the hands of a professional marksman with a steady hand. The middle left panel is the result for a professional marksman using a rifle whose sighting scope is not calibrated. The middle right panel is the result for an amateur (with a shaky hand) using a calibrated rifle. The far right panel is for an amateur shooting an un-calibrated rifle.
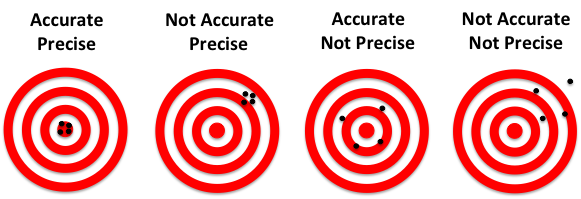
Figure 1: Illustration of accuracy vs. precision using a shooting target.
In this analogy, each shot of the rifle corresponds to a single qPCR reaction. The σRelative is a measure of precision or random error. σCalibration is a measure of the systematic error or accuracy. The σAbsolute is the total error that results from both σRelative and σCailbration. Factors that contribute to σRelative include the Poisson sampling error (described below), pipetting errors in the amounts of target and other reagents, and noise in the qPCR data. Averaging the replicates reduces the random error and results in a smaller σRelative., which represents the standard error of the mean for the replicate set. The more replicates that are performed, the smaller theσRelative. The σCalibration can be improved by performing a calibration plate with more replicates and using the proper mean copy number.
Best Practices:
- For your samples (i.e. unknowns), perform as many replicates as possible to decrease the relative error.
- Calibrate your pipettes and use good pipetting technique to reduce the random and systematic errors (improves both relative and absolute quantification).
- Performing a calibration plate with as many replicates as possible is highly recommended. Keep in mind that the calibration plate only needs to be performed once for each assay design and is instrument and sample independent and never needs to be repeated. Thus it is best to perform many replicates for the calibration plate and then all subsequent Copy Counts will have the highest possible accuracy.Note: If you do not perform a calibration plate, then the copy count results are still highly precise and thus reliable for relative quantification, but the absolute quantification inaccuracy will be within 20-30%, and in rare circumstances could be substantially larger than this.
Basic Error Analysis:
About replicates.
Performing replicate PCR experiments allows the calculation of the standard deviation among those replicates:
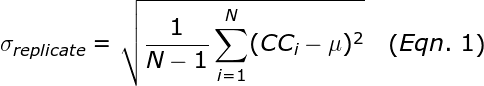
where N is the number of replicates, μ is the average copy count of the replicates, and CCi is the copy count number for well i. The σReplicate represents the expected error for a single qPCR well. The Poisson sampling error is given by the square root of the copy count. Thus, if the mean copy count is small (less than 400 copies), then the Poisson sampling error is the dominant contribution to the σReplicate. Such Poisson error occurs even if the user pipettes perfectly.
The average or mean, is significantly more reliable than a single measurement. The standard error in the mean, σMean (also called σRelative), is given by:
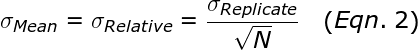
Thus, performing more replicates can dramatically reduce the error in the mean (i.e. σRelative). For example, performing 16 replicates results in 4-fold smaller error than a single qPCR reaction.
The coefficient of variation, CV, is the ratio of the error divided by the mean. Thus, the CVRelativeis given by:
![]()
The absolute error is the combination of the relative error and the calibration error as follows:
![]()
Table 1 illustrates the effects of different combinations of calibration and relative errors. Note the absolute errors are dramatically smaller for calibrated assays than for uncalibrated assays.
| Case | CVCalibration | CVRelative | CVAbsolute |
|---|---|---|---|
| Accurate & Precise | 0.03 | 0.01 | 0.032 |
| Inaccurate & Precise | 0.20 | 0.01 | 0.200 |
| Accurate & Imprecise | 0.03 | 0.04 | 0.050 |
| Inaccurate & Imprecise | 0.20 | 0.04 | 0.204 |
Table 1: Effect of different Calibration and Relative errors on Absolute Error from Eqn 4.
Notes: Errors shown are typical for if the calibration plate has 384 wells (i.e. CVCalibration = 3%) and 16 replicates (CVRelative = 1%) are performed on the unknowns. Assays that are uncalibrated are assumed to have 20% calibration error. A sample with only a single replicate (imprecise) are assumed to have 4% relative error.
Two-step Assay Calibration Procedure for TaqMan Assays
Introduction
The following procedure is performed on each new qPCR assay that will be analyzed by qPCR CopyCount. The method is called “2-step” because it involves two qPCR reactions: one preliminary PCR with 4 replicates to get a rough concentration, and one full plate of PCR reactions to get the precise TaqMan assay calibration. This method is faster, more accurate, and more reliable than a dilution series with standards. The calibration needs to be performed only once on each new assay design – the same calibration will work on any instrument and with any sample and will never need to be redone as long as the primers are not redesigned, the primer and probe concentrations are not changed, and the PCR buffer components (i.e. [NTPs], [Mg], and [Enzyme]) are not changed. Thus, it is best to perform the calibration once with as many replicates as possible so that the assay can be used in the future with optimal accuracy.
Background Concept
Read the document: Quick Guide Precision vs. Accuracy of qPCR CopyCount. This provides a brief description of the role of calibration to improve absolute quantification.
Outcome
The calibration error, σcalibrationdepends upon the number of replicates and the mean copy number among the replicates. A 384-well calibration of an assay will provide σcalibration of about 5% inaccuracy if the mean copy number per well is 1.5. For a 96 well plate, the calibration errors will be twice as large as from a 384 well plate. Below is the equation for calculating the approximate calibration error:
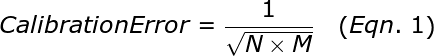
where N is the number of replicates and M is the average copy number per well. Note that for technical reasons, it is not advisable to go above a copy number of 2.5 in performing your calibration plate. Thus, to give a little safety margin, we recommend that you use a mean copy number of about 1.5 for the calibration plate. We also strongly recommended that you use a calibration plate with as many replicates as possible so that error is minimized.
Laboratory Protocol
Note:If you know your initial DNA concentration very accurately (within 25% error), then you can skip step 1 and go directly to step 2.
Step 1A -Initial PCR
This protocol is written assuming 20 μL qPCR reactions. If your instrument uses a different volume, then scale the amounts of target and other reagents such as master mix and primers and probes accordingly. Prepare a 10 μL sample, labeled “Target DNA”, that contains between 1,000 and 100,000,000 copies of Target DNA (no need to be wasteful here, we just need at least 1000 molecules for the entire calibration procedure). Add 2 μL of the target DNA to a centrifuge tube labeled “reaction mix”. Add to the “reaction mix” tube 50 μL of 2X master mix (or 10 μL of 10X master mix) and appropriate volumes of primers and probe. Add water to make the final volume = 100 μL, which is sufficient for 5 PCR reactions, but only 4 PCR reactions will be run. Mix well and pipette 20 μL of the resulting mix into each of four reaction wells in the qPCR plate. The excess ~20 μL can be discarded (100 μL of reaction mix was prepared to be sure that there is enough for the 4 reactions to get a full 20 μL).
Step 1B – Obtain Estimated Copy Count
Run qPCR CopyCount on the four qPCR reactions from step 1A. This will give a rough estimate of the copy count, CC. Average the CC for the four replicates. This estimate provides the DNA copy number to within ±25% as long as your PCR reaction conforms to the limitations for cPCR.
Step 2A – Prepare Calibration Plate
The goal of this step is to prepare a PCR reaction sufficient for 400 wells that each contain about 1.5 molecules of DNA on average (so a total or 600 target molecules are needed). Compute the total molecules that remain in the 8 uL Target DNA sample from step 1A. This is accomplished using the copy count, CC, from step 1B as follows:
![]()
where the factor of 20 is because the remaining Target sample has 4-fold as much DNA in 8 μL compared to 2 μL, and that was effectively split into 5 reactions worth of volume in step 1A. From the total from Eqn. 2, compute the volume that contains 600 molecules. For example, if the Total = 1352 molecules then the volume needed is:

Note that the volume used does not need to be perfectly exact (for example if you pipetted 3.5 μL that would be fine), the number of molecules could be off by a few percent and that will have no effect on the calibration. If the volume computed with Eqn. 3 is too small (like 0.01 μL), then you will need to first dilute the sample by adding water, and then pipetting out the amount needed taking into account the added dilution. Pipette the volume needed from Eqn. 3 into a fresh 20 mL tube labeled “Calibration Reaction Mix”. Since we are preparing reaction mixture for 400 reactions with 20 μL each, the total reaction volume is 8000 μL. Add to the “calibration reaction mix” tube 800 μL of 10X qPCR components (master mix, primers and probe) and add water to make the final volume = 8000 μL, which is sufficient for 400 PCR reactions, but only 384 PCR reactions will be run.
Notes:
- It is essential to acquire a sufficient number of PCR cycles to allow for saturation to be observed. We suggest 60 cycles for 10-20 μL reaction volumes (if your volume is much smaller, like 33 nL, then fewer cycles can be used as long as full saturation is observed even for a single copy of DNA at cycle zero).
- We recommend that the PCR extension time is 1 minute to ensure that all amplicons are fully extended.
Step 2B – Run Your Calibration Plate
Run qPCR CopyCount and select “Calibration Plate”. Upload the data from step 2A, and give a name for the assay that you are calibrating. The program will do the rest. The calibration for that assay will be saved to your database of assays so that you can use it for sample unknowns in the future.
Notes:
- Rarely, some assays may be very poorly designed resulting in aberrant behavior. If your calibration produces a message “Calibration plate unreliable due to poor Chi-squared P”, this is an indication that your assay is poorly designed (e.g. the primers are highly inefficient due to competing secondary structure) or that there is some other problem with the PCR, such as very bad contamination or poor reagent quality.
- If your estimated copy count in step 1B is incorrect by more than a factor of 2, then you will get the message: “Calibration plate unreliable due to high copy number”. This means that you will need to further dilute your sample (we recommend diluting by 2- to 3-fold more) and run a new calibration plate.
Quick Start Guide for qPCR CopyCount
Purpose: This CopyCount Quick Start Guide provides the basic information and best practices for running qPCR CopyCount.
Best practices for setting up your qPCR plate
- We recommend that each sample be run with at least 4 replicates. This allows for outliers to be detected and for averaging to improve the quality of your results.
- It is best to set up your plate with many different samples and replicates but only a few different assays. We recommend that each 96-well plate contain no more than 4 different assays. Larger plate formats can accommodate more assays.
- Perhaps the largest contributor to reducing error is the quality of pipetting. Minimizing random and systematic errors in pipetting is essential to obtaining high quality results. If you are not already familiar with these concepts, please review forward pipetting, reverse pipetting, repetitive pipetting, heterogeneous pipetting, and pipette calibration.
What you need before running qPCR CopyCount
- Export the raw data file (in .xls, .xslx, .csv, .txt or .tsv formats ) that contains the fluorescence and cycle-number information. Note that it is very important to submit raw data, not smoothed data (smoothing changes the shape of the qPCR curve and thus corrupts that determination of the copy count).
- What is the layout of samples, replicates and assays on your plate? Please see definitions below.
- What is your qPCR reaction volume?
- Are your target DNAs or RNAs single stranded or double stranded?
- What are the names of the assays that are present on your plate?
- Has your assay been previously calibrated?
Advantages of qPCR CopyCount
- Every qPCR well is now an absolute qPCR.
- No dilution series required
- No internal or external calibration standards
- Results are instrument independent and fluorophore independent.
- Archived qPCR datasets can be analyzed, which enables meta-analysis.
- cPCR can use TaqMan Probes or Duplex Binding Dyes (however, duplex binding dyes are susceptible to non-specific amplification artifacts).
Limitations of qPCR CopyCount
- Must use Hot Start PCR to minimize premature amplification and also delayed onset PCR.
- Will not work with circular plasmid targets (linear plasmids are OK)
- Will not work with unsheared genomic DNA targets (but does work with sheared genomic DNA).
- Currently does not work for asymmetric PCR or certain other primer strategies (such as castPCR™, or myT®primers, or competimer™).
- Getting best results (absolute quantification accuracy of 5% for a single well) requires one-time calibration for each new assay design (i.e. primer set and master mix).
- Cannot be applied to end-point PCR data
Definitions
Sample: The sample is the biological specimen (human, animal, plant, environment, or other) that contains the target nucleic acid intended for quantification. Typically, the same assay (defined below) will be run on many different samples. The number of assays, samples, and replicates can vary, so please follow the equation below to determine the total number of wells.
Total Wells = Samples x Replicates x Assays
Replicate Set: If two or more wells contain the same sample and the same assay, then those wells form a “replicate set.” Typically, 4 to 96 replicates are run on each sample. The program needs this information to assign which wells should be averaged. Essentially, more replicates means lower error bars.
Why this is important: These replicate sets tell the program which wells should be averaged together to calculate the “Mean Copy Number.” Every well must have assigned to it an assay name and a replicate set name. It is important that the user declare to the program the replicates that correspond to the plate layout that was actually performed. If a well is not declared in any replicate set, then it will be ignored by the program and no copy number will be produced for such undeclared wells. Unused wells should not be declared. Wells with no template controls (NTC) should be declared as a separate replicate set so that the program will appropriately analyze NTCs to determine if any of those wells unexpectedly contain target DNA (i.e. false positives).
Assay: If two qPCR reactions have either a different set of primers or a different master mix, then those reactions are considered to be different assays. A typical qPCR plate will have 1 to 4 different assays. The user needs to provide some information about the assay: is the target double stranded, [primer], [probe], amplicon length, and whether the probe contains an MGB. Each replicate set must have an associated assay name.
Why this is important: qPCR CopyCount uses the assay information to do proper fitting of the curves. If you provide wrong information, it will affect the accuracy of the results.