Visual OMP™
( Oligonucleotide Modeling Platform )
Desktop software for simulating and visualizing assay artifacts.
Visual OMP™ can be used for Simulation, Visualization, troubleshooting, manual assay optimization of primers and probes.
Advantages of Visual OMP™
- “Best in class” simulation and visualization to examine secondary structure and impediments to hybridization or primer extension.
- Powerful algorithms for designs which use the nearest-neighbor model along with coupled multi-state equilibrium models in order to simulate thousands of possible combinations to identify and find the most selective and sensitive oligo solution sets.
- Correct thermodynamic parameters for assay optimization and folding prediction.
- Visual OMP™ accommodates both Taqman probes & Taqman minor groove binding probes properly accounting for solution conditions (temperature, primer concentrations, salt, buffers, additives, etc.)

Primer and probe resolution
DNAS customers rely on Visual OMP for simulation, visualization, and “whatif scenarios” in primer and probe failure. Visual OMP helps to troubleshoot assays and the science that underpins the software, the multi-state coupled equilibrium model, correctly computes the amount bound for primers and probes.

Types of Design with Visual OMP
PCR Primer Design
Poor primer PCR design is the one major cause of all failures or false positives or negatives in single and multiplex PCR. Primers may fail for many different reasons and the major factors that affect PCR primer designs are:
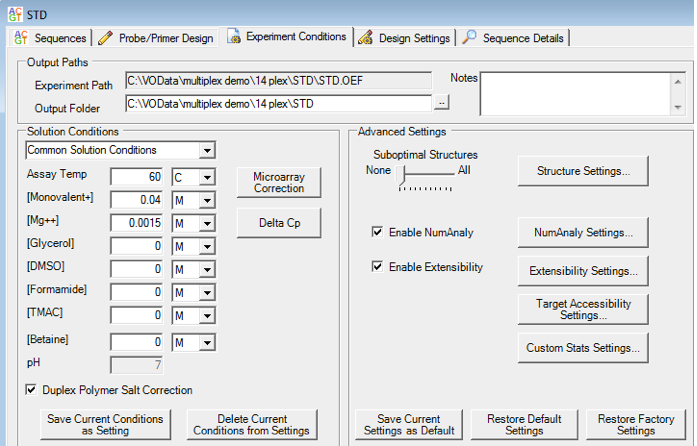
- Assay temperature which affects the equilibrium constant of oligo binding, hence the amount of primer that binds its target.
- Cation concentration (K+, Na+, Mg2+, NH4+) which affects the stability of one oligonucleotide binding to another.
- Buffer additives / consistencies such as denaturants or viscosity. Current buffer additives include glycerol, DMSO, formamide, TMAC and betaine, all of which will affect the thermodynamic stability of oligo hybridization.
- Desired annealing temperatures for primers and probes, which is related to oligo length and amplicon size.
- Secondary structure which affects any oligonucleotide and its ability to bind to another oligonucleotide or itself. Visual OMP uses a dynamic programming algorithm to calculate the energy of all possible structures by using our thermodynamic database. The optimal and nearby suboptimal structures are predicted to be the most populated at equilibrium.
- Synthetic nucleotide modification, such as modified backbones, sugars or bases that have the ability to increase or decrease target binding.
Multiplex PCR Primer Design With Visual OMP
Visual OMP (multiplex PCR primer assay design software) can design multiple primers and probes at the same time using a dynamic design algorithm that queries each oligo design against every other oligo in the system to check for intended and unintended cross- and mishybridization.
The size of the plex design depends on many factors such as target number, length, complexity and secondary structure, all of which further depends on the defined experimental conditions that are used.
A typical use case would involve a 20-plex of targets that are about 500 nucleotides long at standard endpoint PCR conditions. Multiplex pcr assay designs that are larger than this would require the use of OMP-Developers Edition, which is a server-based command line design and simulation application.
Analyze Existing PCR
Visual OMP‘s simulation engine is a very powerful tool which uses multi-state coupled equilibrium to analyze the behavior of existing assays that did not perform as predicted in design due to poor thermodynamic design or the existence of prohibitive secondary structures.
Once the offending primers or probes are identified, then Visual OMPs design engine can design new oligos in the presence of the existing oligos to optimize assay sensitivity and selectivity.
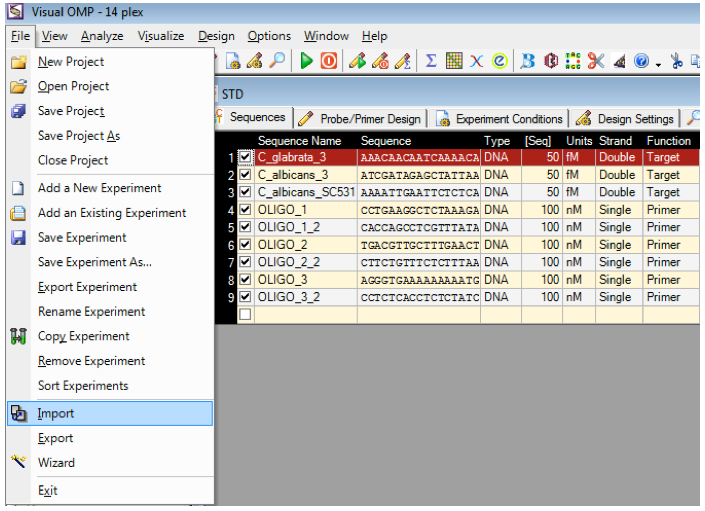
Existing sequences can be imported into Visual OMP from a fasta file and if the file contains no nomenclature, then the sequences will be imported as Oligo_1 and so on.
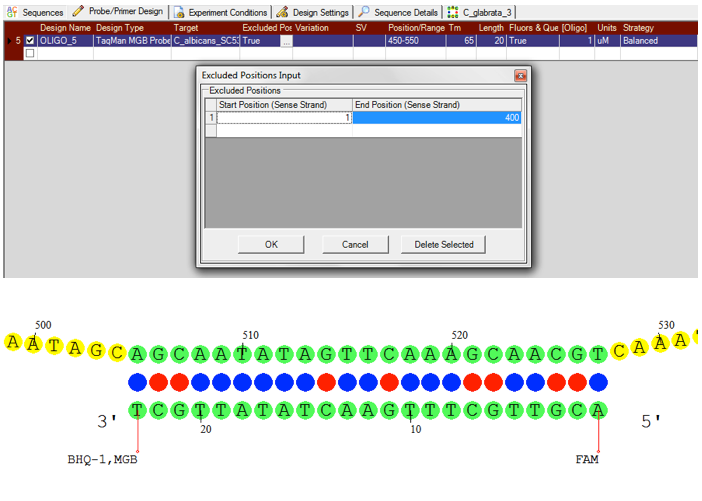
Taqman Design
Visual OMP can design both Taqman Probes and Taqman Minor Groove Binder Probes, depending on your application while the simulation engine accounts for the thermodynamic contributions of the available fluorophore and quencher sets and the contribution of the minor groove binder.
Furthermore, it is possible to exclude or selectively target various target regions during design. DNA Software’s extensive fluorophore and quencher library has been experimentally validated and tested for the most accurate simulations possible.
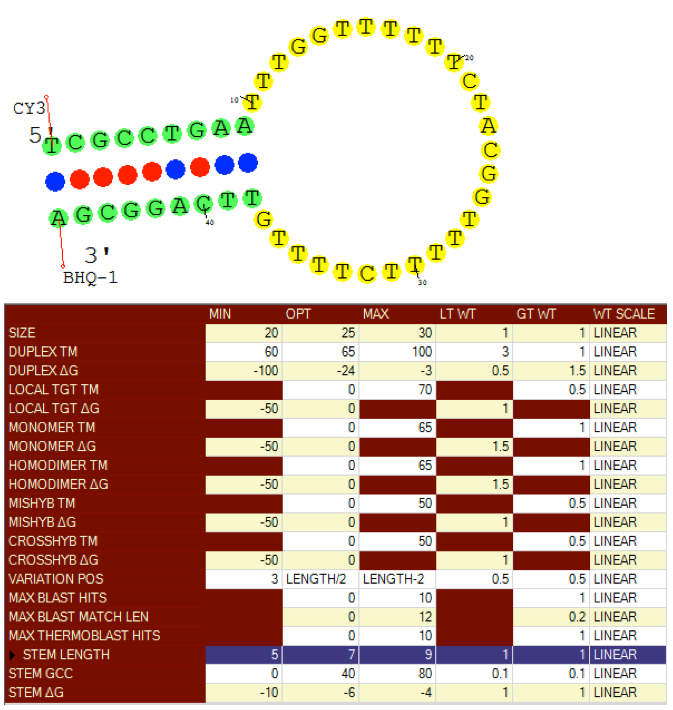
Molecular Beacon Design
Visual OMP designs both molecular beacons and allele specific molecular beacon pairs. Loop and stem size, melting temperature and free energy can be controlled to optimize selectivity and sensitivity of designed beacons.
Beacon stems are designed to not mishybridize to adjacent target sequences which may quench a fluorophore report and the stem can be optimized with a terminal G/C pair stem terminal option.
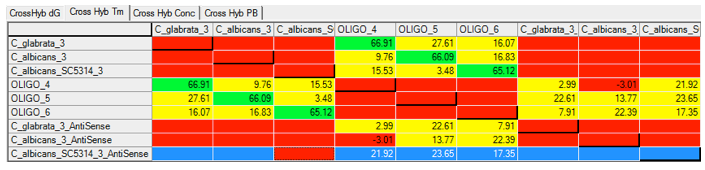
Probe Design and Analysis
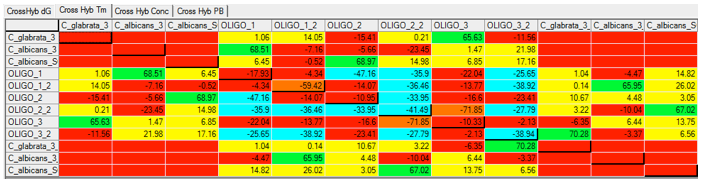
Using Visual OMP‘s cross-hybridization grid a user may visually inspect all heterodimer interactions between oligos in seconds, and determine the problem probes and targets that are not functioning as predicted due to significant cross-hybridization or mishybridization.
The cross-hybridization grid may be filtered so that a user may color customize the interactions of importance. In the figure below all of the intended hybridization from this microarray probe is labeled by green boxes.
Polymorphism Design and Simulation
Visual OMP is also able to design allele specific primers and probes over or around single SNP sites for the binary IUPAC ambiguity codes.
In this example a C. albicans sequence with a W ambiguity code (A or T) is 97.95 % differentiated by Visual OMP using two allele specific forward primers and a common reverse primer.
Multiple SNP sites or ambiguity codes are not supported at this time.

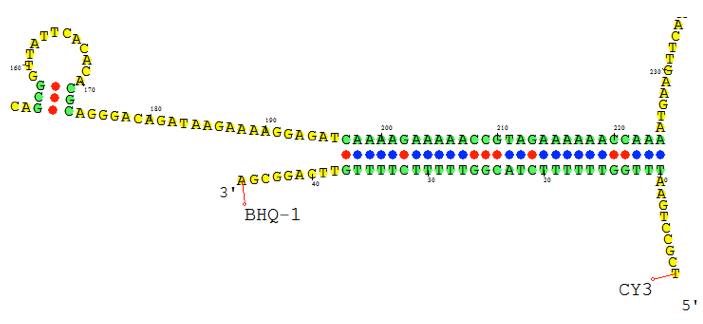
Target Selection
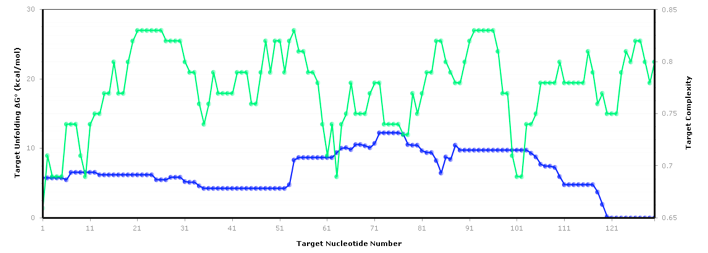
The figure below shows an RNA sequence fold in Visual OMP with its Target Accessibility plot, which shows a user the best areas, given experimental conditions, to design primers and probes.
The regions where the target complexity (green) and target unfolding DG (blue) overlap on the Accessibility plot are the regions where the strongest secondary structure exists, and as such, these areas should be avoided for design.
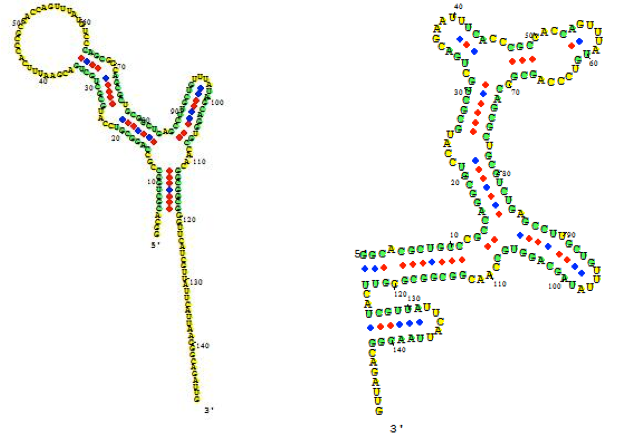
The Target Accessibility plot for the RNA sequence fold top left under experimental conditions of 55 ˚C, 50 mM NaCl and 0.5 mM MgCl2.

The Target Accessibility plot for the RNA sequence fold top right under experimental conditions of 37 ˚C and 1 M NaCl.

“DNA Software has passed my tests. I’ve recommended Visual OMP™, it performs extremely well.”
Interested in learning more about Visual OMP™?
Visual OMP™ simulates and optimizes your difficult targets and ThermoSleuth™ eliminates false positives from unwanted amplicons. See how Visual OMP™ can benefit your organization.