Author: wahost
DNA Software Receives the 2023 Technology Innovation Leadership Award

DNA Software has been identified as best in class in the North American multiplex PCR solutions industry.
Frost & Sullivan applies a rigorous analytical process to evaluate multiple nominees for each Award category before determining the final Award recipient. The process involves a detailed evaluation of best practices criteria across two dimensions for each nominated company. DNA Software excels in many of the criteria in the multiplex polymerase chain reaction solutions space.
Multiplex Polymerase Chain Reaction: Market Overview
Pharmaceuticals and biotechnology companies consider polymerase chain reaction (PCR) the gold standard for modern diagnostics. Unlike conventional singleplex PCR, multiplex PCR simultaneously detects multiple targets in a single reaction well. As a result, Frost & Sullivan notes that its advantages include cost effectiveness, timesaving, higher throughput, increased data normalization accuracy, reduced pipetting errors, and deriving more information with a smaller sample.
However, multiplex panel designs must ensure accuracy to avoid false negatives. Technique limitations include insufficient models and knowledge regarding hyrbidization, suboptimal tools (design freeware), and advanced algorithms operating on inadequate information technology infrastructure. DNA Software™ (DNAS) uniquely leverages its expertise to meet customer needs. Frost & Sullivan analysts observe that the company is well-positioned to capitalize on new growth opportunities, cementing its position in the multiplex PCR solutions market.
A Commitment to Innovation and Creativity
Founded in 2000 and headquartered in Michigan, the United States (US), DNAS is a deoxyribonucleic acid (DNA) diagnostic design and analysis solutions provider. The company has helped hundreds of organizations overcome challenges and increased clients’ time-to-market through its cutting-edge multiplex software. In 2019, Frost & Sullivan recognized DNAS for its multiplex software, reflecting cloud computing, modern algorithms, and a deep understanding of PCR mechanisms, and remains impressed © Frost & Sullivan 2023 The Growth Pipeline Company™
with the company’s continuing innovation and recent offering of pre-validated PCR kits. DNAS recognizes unmet client needs and ensures that it develops solutions truly meeting customer and market demands. Burgeoning from the renowned scientist Dr. John SantaLucia Junior’s laboratory at Wayne State University, the company nurtures a research-focused culture propelling innovation. The team includes world-leading DNA and ribonucleic acid (RNA) biophysical chemistry experts who develop best-in-class algorithms for predicting hybridization and folding. As a result, DNAS’ technology accelerates the discovery process from months to minutes – saving an impressive 80% of research and developmentrelated resources.
Its software offerings include:
- OMP-DE™: The Oligonucleotide Modeling Platform is DNAS’ programmable predictive modeling environment that forms the core of its product line. OMP encapsulates the company’s chemical and biological data into a single design and simulation PCR script software platform.
- ThermoBLAST™: Addresses primer specificity by scanning multiple primers against genome collections to find all hybridizations and amplicons. Unlike the traditional BLAST, it captures critical mishybridization hits through appropriate thermodynamic scoring based on complementarity as opposed to similarity, displaying all false amplicons, considering extensibility and stable mismatches, and allowing for solution conditions, buffers, salt, additives, and other experimental factors.
- CopyCount™: A breakthrough in understanding quantitative (q) PCR, the product allows for the absolute quantifying of qPCR, eliminating the need for a standard curve, excessive replicates, or sample dilution. As a result, CopyCount saves time and money, generates easy-to-interpret results, and is compatible with existing qPCR instrumentation.
- Visual OMP™: Desktop software for visualizing and simulating assay artifacts.
- PanelPlex™: The multiplex PCR design software for cancer panels, anti-microbial resistance, and other applications has been rigorously validated for detecting diverse bacteria, viruses, and human targets. It saves an average of six to nine months of iterative experimental trial-and-error optimization, produces diagnostic quality designs and automated consensus designs of multiple variants of DNA or RNA targets, uses ThermoBLAST playlists to scan for off-target hybridizations, and scales the multiplex PCR assay design process.
- PanelPlex™-Consensus: Rigorously validated for detecting more than 1,000 bacteria, viruses, and human targets with wet-lab-validated results, the consensus design for infectious diseases leverages cloud computing. It saves an average of at least six months of iterative experimental trial-and-error optimization, produces diagnostic quality designs and automated consensus designs of multiple variants of DNA or RNA targets, uses ThermoBLAST playlists to scan for off-target hybridizations, scales the multiplex PCR assay design process, and has a massive capability.7
Cayman Chemical Expands Molecular Diagnostic Research Offerings Through Partnership with PCRassays.com
ANN ARBOR, MI, JUNE 5, 2024—Cayman Chemical, a leading supplier of research tools for the life science community, has widened their portfolio to include molecular-based detection kits through a strategic partnership with PCRassays.com. PCRassays.com offers more than 200 qPCR-based assays for infectious diseases, over 50 of which are multiplex assays, including panels for wound, upper respiratory, urinary tract, and sexually transmitted infections.
“We are delighted to be partnering with Cayman Chemical to provide our portfolio of assays worldwide,” said shared company founder and CEO, John SantaLucia. “Cayman has a long-standing and exceptional breadth of products offered to the research community, and we’re enthusiastic about adding further value for researchers.” PCRassays.com’s line of products has been designed using DNA Software, the industry-leading multiplex design software. Multiplex PCR kits save researchers time and expenses by allowing for simultaneous detection, minimal enzyme amounts, and high-throughput analysis.
PCRassays.com is based out of Plymouth, MI and one of the many biotechnology companies representing Michigan, making this a growing hub for the life sciences. “We are honored and proud to be a part of a consortium of Michigan-based companies impacting the life sciences ecosystem in a meaningful way,” added Dr. SantaLucia. “We have engineered our enzyme formulations with Fortis (Empirical Biosciences), collaborated with the State of Michigan Department of Health and Human Services for the development of a novel assay, and have now partnered with Cayman Chemical, the leading Michigan-based company supplying life science reagents for researchers worldwide.”
To view products offered by Cayman Chemical & PCRassays.com, visit www.caymanchem.com/pcrassays |
About Cayman Chemical
Cayman Chemical helps make research possible by supplying scientists worldwide with biochemical tools used to understand cancer, neurochemistry, oxidative injury, endocrinology, atherosclerosis, and other human health challenges. Our scientists are experts in the synthesis, purification, and characterization of biochemicals ranging from small drug-like heterocycles to complex biolipids, fatty acids, and many others for use as research reagents and qualified standards. We are also highly skilled in all aspects of assay and antibody development, protein expression, crystallization, and structure determination. In addition, we offer a wide range of analytical services using LC-MS/MS, HPLC, GC, and many other techniques. Cayman performs generic drug development and production in both Ann Arbor, Michigan and Neratovice, Czech Republic. Learn more at www.caymanchem.com.
About PCRassays.com
PCRassays.com provides multiplexed research use only qPCR kits for the detection of human pathogens, food borne pathogens, wastewater surveillance, and research-based applications. PCRassays.com offers flexible multiplex configurations and has an automated design platform (DNA Software) for ever changing market dynamics. The team at PCRassays.com has world-leading expertise in nucleic hybridization, structure folding, and thermodynamics. In addition to our assays, we offer client services for custom assay design and development.
Which Version of the Human Genome Should I Use?
Written by John SantaLucia, Jr.
Updated 5-5-2024
Sequencing of the human genome required an international effort over 35 years starting in the late 1980’s with the first rough draft (<90% complete) published in 2001.1,2 Over the next 12 years the completion improvements released in 2009 (GRCh37) and 2013 (GRCh38).3,4 The GRCh38 version was 92% complete, and was widely utilized in studies of human disease and variation. Then, finally in 2022 the Telomere-to-Telomere consortium (T2T) finished the first truly complete human genome sequence.5-12 Due to this history, there is a vast quantity of literature that use the coordinates from the older sequences. For example, there are many exome sequencing databases and SNP databases (such as dbSNP and COSMIC) that use the older GRCh37 and GRCh38 versions. Thus, a common question that we get is “Which version of the human genome should I use?”. Table 1 gives the RefSeq accessions for three most widely used versions of the human genome. The RefSeq accessions are preferred over GenBank accessions, because the RefSeq accessions also contain the full annotation information for genes, ncRNAs, and other features (though the T2T version of mitochondria has not yet been deposited into RefSeq). The T2T version has no ambiguity codes, no gaps, and corrects previous scaffold mistakes. Table 2 gives the percentage ambiguity codes for each chromosome in the three different versions of the human genome (data compiled using ThermoSleuth from DNA Software, Inc.). Table 3 gives different metrics of completion for the three different versions of the human genome.3 Table 4 gives a detailed comparison of the T2T vs. GRCh38 versions.5
We strongly encourage our users to utilize the T2T version, which is the first truly complete human genome sequence. Both ThermoSleuth and PanelPlex support all 3 major versions of the human genome (Table 1). If you need to convert coordinates from different genome versions, see the links in the “Additional Resources” section.
Additional resources:
- Website with information about annotations in the T2T genome: https://www.ncbi.nlm.nih.gov/refseq/annotation_euk/Homo_sapiens/GCF_009914755.1-RS_2023_03/
- Useful website for converting between different genome versions (this is fine if you just have a few conversions to do): http://genome.ucsc.edu/cgi-bin/hgLiftOver
- Useful site that describes several different software packages for high-throughput conversion of many coordinates between different genome versions: https://www.biostars.org/p/65558/
- Website that describes the differences between hg19 and hg38: http://seqanswers.com/forums/showthread.php?t=75570
- Website for converting a chromosome location to transcript oriented position: https://mutalyzer.nl/position-converter
- Other tools: Bowtie2, Picard Tools, SAMtools
Table 1: RefSeq Accessions for Three Versions of the Human Genome
| Chromosome | GRCh37.p13 (hg19) | GRCh38.p7 (hg38) | T2T (CHM13v2.0) |
|---|---|---|---|
| 2-27-2009 | 12-17-2013 | 4-1-2022 | |
| 1 | NC_000001.10 | NC_000001 or NC_000001.11 | NC_060925.1 |
| 2 | NC_000002.11 | NC_000002 or NC_000002.12 | NC_060926.1 |
| 3 | NC_000003.11 | NC_000003 or NC_000003.12 | NC_060927.1 |
| 4 | NC_000004.11 | NC_000004 or NC_000004.12 | NC_060928.1 |
| 5 | NC_000005.9 | NC_000005 or NC_000005.10 | NC_060929.1 |
| 6 | NC_000006.11 | NC_000006 or NC_000006.12 | NC_060930.1 |
| 7 | NC_000007.13 | NC_000007 or NC_000007.14 | NC_060931.1 |
| 8 | NC_000008.10 | NC_000008 or NC_000008.11 | NC_060932.1 |
| 9 | NC_000009.11 | NC_000009 or NC_000009.12 | NC_060933.1 |
| 10 | NC_000010.10 | NC_000010 or NC_000010.11 | NC_060934.1 |
| 11 | NC_000011.9 | NC_000011 or NC_000011.10 | NC_060935.1 |
| 12 | NC_000012.11 | NC_000012 or NC_000012.12 | NC_060936.1 |
| 13 | NC_000013.10 | NC_000013 or NC_000013.11 | NC_060937.1 |
| 14 | NC_000014.8 | NC_000014 or NC_000014.9 | NC_060938.1 |
| 15 | NC_000015.9 | NC_000015 or NC_000015.10 | NC_060939.1 |
| 16 | NC_000016.9 | NC_000016 or NC_000016.10 | NC_060940.1 |
| 17 | NC_000017.10 | NC_000017 or NC_000017.11 | NC_060941.1 |
| 18 | NC_000018.9 | NC_000018 or NC_000018.10 | NC_060942.1 |
| 19 | NC_000019.9 | NC_000019 or NC_000019.10 | NC_060943.1 |
| 20 | NC_000020.10 | NC_000020 or NC_000020.11 | NC_060944.1 |
| 21 | NC_000021.8 | NC_000021 or NC_000021.9 | NC_060945.1 |
| 22 | NC_000022.10 | NC_000022 or NC_000022.11 | NC_060946.1 |
| X | NC_000023.10 | NC_000023 or NC_000023.11 | NC_060947.1 |
| Y | NC_000024.9 | NC_000024 or NC_000024.10 | NC_060948.1 |
| mitochondria | NC_012920.1 | NC_012920.1 | CP068254.1 or NC_012920.1 |
Table 2: Percent ambiguity in different versions of the human genome
(data from ThermoSleuth (DNA Software, Inc.)
| Chromosome | GRCh37.p13 (hg19) | GRCh38.p7 (hg38) | T2T (CHM13) |
|---|---|---|---|
| 1 | 9.62 | 7.42 | 0 |
| 2 | 2.05 | 0.68 | 0 |
| 3 | 1.63 | 0.1 | 0 |
| 4 | 1.83 | 0.24 | 0 |
| 5 | 1.78 | 0.15 | 0 |
| 6 | 2.17 | 0.43 | 0 |
| 7 | 2.38 | 0.24 | 0 |
| 8 | 2.37 | 0.26 | 0 |
| 9 | 14.92 | 12.00 | 0 |
| 10 | 3.11 | 0.40 | 0 |
| 11 | 2.87 | 0.41 | 0 |
| 12 | 2.52 | 0.10 | 0 |
| 13 | 17.00 | 14.32 | 0 |
| 14 | 17.76 | 15.39 | 0 |
| 15 | 20.32 | 17.01 | 0 |
| 16 | 12.69 | 9.45 | 0 |
| 17 | 4.19 | 0.41 | 0 |
| 18 | 4.38 | 0.35 | 0 |
| 19 | 5.62 | 0.30 | 0 |
| 20 | 5.69 | 0.78 | 0 |
| 21 | 27.06 | 14.18 | 0 |
| 22 | 31.99 | 22.94 | 0 |
| X | 2.69 | 0.74 | 0 |
| Y | 55.79 | 53.84 | 0 |
Table 3: Completion metrics for different versions of the human genome3
| Metric | GRCh37.p13 (hg19) | GRCh38.p7 (hg38) | T2T (CHM13) |
|---|---|---|---|
| Number of ambiguities | 234350281 | 150630719 | 0 |
| Unplaced scaffolds | 39 | 127 | 0 |
| Collapsed repeats | Yes | Yes | No |
| Percent Completion | 90% | 92% | 100% |
Table 4: Comparison of GRCh38 and T2T versions of Human Genome5

References:
- International Human Genome Consortium. “Initial sequencing and analysis of the human genome” Nature, 409: 860-921 (2001).
- Venter, J.C. Adams, M.D., Myers, E.W., Li, P.W., Mural, R.J., et al. “The sequence of the human genome” Science, 291: 1304-1351 (2001).
- Guo, Y., Dai, Y., Yu, H., Zhao, S., Samuels, D.C., Shyr, Y. “Improvements and impacts of GRCh38 human reference on high throughput sequencing data analysis” Genomics, 109, 83-90 (2017).
- V. A. Schneider, T. Graves-Lindsay, K. Howe, N. Bouk, H.-C. Chen, P. A. Kitts, T. D. Murphy, K. D. Pruitt, F. Thibaud-Nissen, D. Albracht, R. S. Fulton, M. Kremitzki, V. Magrini, C. Markovic, S. McGrath, K. M. Steinberg, K. Auger, W. Chow, J. Collins, G. Harden, T. Hubbard, S. Pelan, J. T. Simpson, G. Threadgold, J. Torrance, J. M. Wood, L. Clarke, S. Koren, M. Boitano, P. Peluso, H. Li, C.-S. Chin, A. M. Phillippy, R. Durbin, R. K. Wilson, P. Flicek, E. E. Eichler, D. M. Church, “Evaluation of GRCh38 and de novo haploid genome assemblies demonstrates the enduring quality of the reference assembly” Genome Res. 27, 849–864 (2017).
- Nurk, S. et al., “The complete sequence of a human genome” Science 376, 44–53 (2022).
- Pennisi, E. “Most complete human genome yet is revealed” Science 376, 15-16 (2022).
- Altemose et al., “Complete genomic and epigenetic maps of human centromeres” Science 376, 56–66 (2022).
- Hoyt et al., “From telomere to telomere: The transcriptional and epigenetic state of human repeat elements” Science 376, eabk3112 (2022).
- Gershman et al., “Epigenetic patterns in a complete human genome” Science 376, eabj5089 (2022).
- Aganezov et al., “A complete reference genome improves analysis of human genetic variation” Science 376, eabl3533 (2022).
- Vollger et al., “Segmental duplications and their variation in a complete human genome” Science 376, 55–66 (2022).
- Church, D.M., “A next-generation human genome sequence” Science 376, 34–35 (2022).
DNA Software: The Difference is in the Design
 DNA Software, Inc. (DNAS) is a Michigan-based life science company located in Plymouth, MI at the Michigan Life Sciences Innovation Center (MLSIC) facility. DNA Software offers state-of-the-art software for the design of nucleic acid diagnostics, particularly in the polymerase chain reaction (PCR) market.
Before COVID, PCR wasn’t necessarily the household term it has become today. Awareness for PCR rapidly increased throughout the pandemic as PCR based testing for disease is recognized as the “gold standard” in diagnostics. Suddenly an acronym that was foreign to most was in the daily news, on the bottom of the sports-ticker and became a new requirement for travel. At a $7B market size pre-COVID in 2019, molecular diagnostics today is a $25B industry in 2024 which will grow to greater than $50B in 2030.
DNA Software has always been uniquely positioned in the PCR and molecular diagnostics space, however, now finds itself at an inflection point in its 23rd year of business. Demand for PCR-based testing from healthcare providers continues to grow. This includes multiplexed PCR based detection methods as multiplex based testing enables many samples to be tested at once to save costs. Multiplexed PCR assays allow for the most accurate detection of many diseases, lowering costs and increasing throughput. “All multiplex roads in molecular diagnostics run through DNA Software” shares Dr. John SantaLucia, founder and CEO of DNA Software, Inc. “Whether licensing software, our services , or our assays, our expertise shines when designing multiple PCR tests simultaneously because of the foundational science discovered at my academic lab at Wayne State University (Detroit,MI) where I was a professor for nearly 30 years”.
PCR tests are not only limited to COVID and respiratory illness (such as FluA/FluB/RSVA/RSVB) but include everything from the flu and strep throat. This also includes a multitude of panels including UTIs (urinary tract infections), STIs (sexually transmitted infections) GI (gastrointestinal) along with many other commonly ordered pathogen tests. Customer benefits include detecting many pathogens simultaneously, superior results and limit of detection while decreasing per sample test costs along with a higher sample throughput.
DNA Software has provided “best in class” software to leading biotech firms for FDA approved molecular diagnostics. DNAS worked on custom projects with Moderna to characterize modified nucleotide behavior in the mRNA vaccine delivery. During the onset of COVID, the Department of Defense contacted DNAS to design SARS-CoV-2 assays along with biodefense panels. DNAS has long been recognized as an industry leader for its software, R&D and client services and was the 2023 recipient for the Frost & Sullivan “best in class” award for multiplex solutions provider in the industry.
PCRAssays, a DNA Software company
Through a “COVID Awakening”, DNA Software realized that R&D teams throughout the molecular diagnostics field relied on its science, algorithms, software and models for diagnostic design. Having provided software and client services to a “who’s who” list of biotech organizations including BD, Cepheid, Roche, Qiagen, Hologic, Thermo Fisher and Eli Lilly, DNAS moved to the MLSIC facility in late 2020 to manufacture its own line of PCR kits and assays through its new subsidiary, wwww.pcrassays.com. DNAS is uniquely positioned to leverage its technology to build high performing multiplexed PCR assays.
To capture more of the value they create, DNAS launched a new brand, PCRassays, which directly provides multiplexed RUO qPCR kits. These assays detect human pathogens, food borne pathogens, and are used for wastewater surveillance and research-based applications. PCRassays offers flexible multiplex configurations. Through its unique automated design platform (DNA Software), these “plug and play” assays are adaptable for ever changing market dynamics. PCRassays has transformed the firm’s digital assets into physical assets as the organization now ships reagents throughout the world for a variety of applications.
Spotlight on Michigan based partnerships
The DNAS subsidiary PCRassays has grown with several Michigan based partners. This includes the State of Michigan Department of Health and Human Services (DHHS) (Lansing, MI) to develop a novel Hepatitis A assay. Recent outbreaks in MI of Hepatitis A brought about the need for the rapid development of a qPCR-based assay and the State of MI elected to work with DNAS and PCRassays for their expertise in the development of such an assay.
The portfolio of infectious disease qPCR assays has grown to nearly 200 pathogens, >50 in multiplex. PCRassays has focused on growing channel partners and distribution to increase its adoption. Michigan based partnerships include enzyme manufacturer Fortis (Formerly Empirical Biosciences in Grand Rapids, MI). Fortis custom formulated an enzyme that optimizes PCRassays kits and its product performance overall.
DNAS has also partnered with Cayman Chemical, (Ann Arbor, MI) a global leading supplier of research tools for the life science community, to widen their portfolio to include molecular-based detection kits through a strategic partnership. To build inroads into the clinical market, DNAS partnered and signed a distribution agreement with Horiba Medical (Canton, MI) to make its assays available to the Horiba team of 80 international distributors.
PCRassays has customers in Michigan that include Great Lakes Medical Laboratories (Farmington, MI), Biogenetics (Southfield, MI) and World Wide Labz (Detroit, MI), Henry Ford Health System (Detroit, MI) and Wayne State University (Detroit, MI).
Recent Awards to DNAS
- 2019 Frost and Sullivan: “Multiplex PCR Software Enabling Technology Leadership Award”
- Part of Collaboration team that published paper on Hachimoji base pairs in Science 2019 (featured in NYT, CNN, Nature, NASA, and other news outlets)
- 2021 (to JSL): AOAC Award “Recognition of Technical and Scientific Excellence: COVID-19 Emergency Response Validation Program Advisory Group”
- 2020: Amazon AWS Diagnostic Development Initiative Award: Phase I
- 2022: Amazon AWS Diagnostic Development Initiative Award: Phase II
- 2022: DNAS wins NVIDIA Inception Award to implement GPU computation
Thought Leadership in the field: Led multi-agency panel (DoD, CDC, FDA, LNL, USDA, etc.) “Recommendations for Developing Molecular Assays for Microbial Pathogen Detection Using Modern In Silico Approaches,” SantaLucia, J., Jr., Sozhamannan, S., Gans, J.D., Koehler, J.W., Soong, R., Lin, N.J., Xie, G., Olson, V. Roth, K., Beck, L.S. J. AOAC Int., 103, 882-899 (2020).
DNA Software introduces the full commercial release of ThermoBLAST Cloud Edition (TB-CE).
ThermoBLAST Cloud Edition Overview
ThermoBLAST Cloud Edition (TB-CE) provides a new standard for evaluating the target specificity of oligonucleotides during PCR primer or probe design. Everybody is familiar with the capabilities of NCBI BLAST, but there are no thermodynamic results and lots of unwanted and meaningless data. ThermoBLAST CE scans oligonucleotides against genomic databases, which can be organized into “playlists”, to thoroughly search for hybridization sites that can cause false positives in multiplexed diagnostic tests or hybridization-based therapeutics. The output data is then organized by thermodynamic stability, which can then be sorted according to annealing temperature to weed out those reactions that are not likely to happen under your specified temperature and salt conditions. Fast and accurate thermodynamic analysis allows for faster design and more success in the laboratory.
ThermoBLAST CE includes the following features:
- Overcomes NCBI BLAST limitations.
- Automatic detection of all thermodynamically stable hybridizations against huge genome databases.
- Automatic detection of PCR amplicons for all combinations of multiplex primers against every GenBank accession in the playlist.
- Increased speed and database management using the computational capacity of Cloud computing.
- Huge repository of formatted and curated sequence databases.
- Create and format custom sequence playlists in minutes.
- Visualize hits in a new Genome viewer.
Archive past results in your secure personal account on the Cloud
The Cost of Using BLAST
Trial and error primer and probe synthesis and optimization is expensive due to a few core BLAST limitations:
- Hits are scored on sequence similarity rather than thermodynamic affinity.
- Simulation is not possible under actual experimental oligonucleotide concentrations and salt conditions.
- False-amplicons and off-target effects cannot be quantified.
- DNA/DNA, RNA/RNA, or DNA/RNA hybrid duplexes cannot be properly scored for basepair matches or mismatch geometry.
- Oligonucleotide secondary structure such as bulges, gaps, hairpins and dangling ends are completely ignored.
- Modified nucleotides and backbones are completely ignored.
ThermoBLAST TM > BLAST
A sample study was performed where a designed set of primers specific to the Y chromosome from the GRCh 38 Human Genome was queried in both ThermoBLAST and BLAST to compare the number of extensible hits and the number of false amplicons that were detected. The results showed that ThermoBLAST detected 765 unique extensible hits in the Y chromosome while BLAST detected only 15. Furthermore, ThermoBLAST detected a total of 946 extensible hits for the forward primer design, where BLAST detected only 52 extensible hits. For the reverse primer ThermoBLAST found over 98% more hits than BLAST, and likewise for the forward primer ThermoBLAST found over 94% more hits than BLAST. Questions about this study can be directed to DNA Software, Inc.
ThermoBLAST TM = Cloud Integration + Custom Genome Playlists+Genome Viewer+The Computational Capacity To Use It
- Increased speed and database management using the computational capacity of Cloud computing
- Huge repository of formatted and curated sequence databases
- Create custom sequence playlists
- Archive past results in your secure personal account on the Cloud
- Visualize hits in Sequence and Genome viewers
ThermoBLASTTM = BLAST speed and database capabilities + OMP Thermodynamics
- Hits are scored based on hybridization affinity rather than sequence similarity
- Detects 100% of the false amplicons in a PCR reaction
- Detects off-target effects of primer and probe mis- or crosshybridization
- Properly scores DNA, RNA, DNA-RNA hybrids and LNA modifications
- OMP thermodynamics properly scores hybridization gaps and bulges and dangling ends
- Optimize primer and probe designs in silico under experimental salt and temperature conditions before synthesis
World-Class Science
ThermoBLASTTM was developed with grants from the NIH and the Department of Homeland Security. The result is that ThermoBLASTTM has the highest level of algorithm development and validation, providing our customers with a state-of-the-art tool.
World-Class Customers
To account for mishybridization, ThermoBLASTTM is trusted by industry and life-science leaders world-wide: CDC, FDA, USDA, NIST, Novartis, J&J, DuPont, Luminex, Life Technologies, Cepheid, Roche, Philips, Canon US Life Science, IMDx, PrimeraDx, and NABsys.
Counting PCR: A new method to obtain absolute DNA copy number without a standard curve
John SantaLucia, Jr. and Gregory J. Boggy
DNA Software, Inc., Ann Arbor MI 48104
Abstract
DNA Software has discovered how to analyze the shape of a PCR curve to reveal the absolute copy number of DNA at cycle zero. This discovery has led to the development of a method for absolute DNA quantification called Counting PCR (cPCR). In cPCR, each copy of DNA is literally counted for each cycle of PCR, the results of which are absolute DNA copy numbers. Because these results are instrument and fluorophore independent, qPCR results from different laboratories can be compared and metaanalysis studies of archived data sets can be performed.
DNA Software has incorporated the principles of cPCR in to qPCR CopyCount, which is a cloud-based service that automatically analyzes quantitative PCR (qPCR) data to derive the absolute DNA copy number of all qPCR reactions without the need for a standard curve.
qPCR CopyCount has been rigorously validated on more than one hundred thousand samples. The high quality of absolute quantification from qPCR CopyCount can be used for a variety of applications such as mRNA gene expression analysis, viral load, genotyping copy number variation, seed zygocity testing, next generation sequencing fragment libraries, and non-invasive detection methods.
qPCR CopyCount is available as an online service at http://portal.dnasoftware.com.
qPCR CopyCount
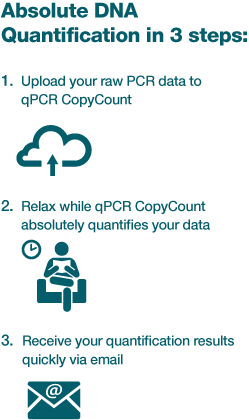
Figure 1: qPCR CopyCount workflow.
qPCR CopyCount is a cloud-based service that automatically analyzes qPCR data to derive the absolute DNA copy number of all qPCR reactions without the need to run a standard curve. qPCR CopyCount builds upon the mechanism-based fitting method described by Boggy and Woolf called MAK2 (Mass Action Kinetic model with 2 parameters).1
The two parameters of MAK2 are the DNA concentration at cycle zero, D0, and the parameter, k, which rigorously accounts for the cycle-by-cycle changes in amplification efficiency. MAK2 was previously limited to providing only relative quantification of the same target in different samples.
DNA Software has built upon the foundation of MAK2 and greatly enhanced it to create qPCR CopyCount, which provides completely automated curve fitting for all major PCR instruments, performs thorough error analysis, has 3-fold better accuracy than MAK2, and greatly improves the reliability of DNA quantification. Most importantly, DNA Software has extended the capabilities of qPCR CopyCount to include cPCR so that absolute quantification without standards is now possible for all qPCR reactions. Figure 1 shows the simple workflow for qPCR CopyCount. A user collects the needed qPCR data and uploads the data to the cloud-based service. qPCR
CopyCountthen carries out the analysis, which includes the following:
- Determining the range of data points that are to be analyzed.
- Determining which qPCR wells have a true sample versus noise.
- Carrying out replicate averaging, outlier detection, and statistical error analysis.
The absolute DNA copy number results are provided to the user in a .csv file that can be opened in Excel or a text editor. A separate analysis file is also provided that details the replicate averaging, outlier detection, and statistical analyses that were carried out.
Counting PCR
Counting PCR (cPCR ) is a method developed by DNA Software for absolute DNA quantification. The basic idea of cPCR is to determine the fluorescence from a single copy of DNA and to use this value to determine the number of copies of DNA in an unknown from its fluorescence at cycle zeroA single qPCR well is sufficient to carry out the analysis.
Consider a simple analogy of counting the number of apples in a basket. You can accomplish this by weighing all the apples in the basket, subtracting the weight of the basket, and then dividing by the weight of one apple.
Similarly, we can count the number of copies of DNA in a sample by measuring the fluorescence of all the copies of DNA (after subtracting the background) and then dividing by the fluorescence of a single copy of DNA. At a typical target DNA concentration, (i.e. <1 million copies per nL), the amount of fluorescence from DNA is much smaller than the background fluorescence. As we result, we cannot directly measure the fluorescence of all the copies of DNA or the fluorescence from a single copy. We can, however, use qPCR to amplify the fluorescence signal in a predictable fashion, and then use the modeling found in qPCR CopyCount to analyze the high signal to noise “bend” in the qPCR curve (Figure 2) to deduce the number of copies of DNA that are present in an unknown at cycle zero.
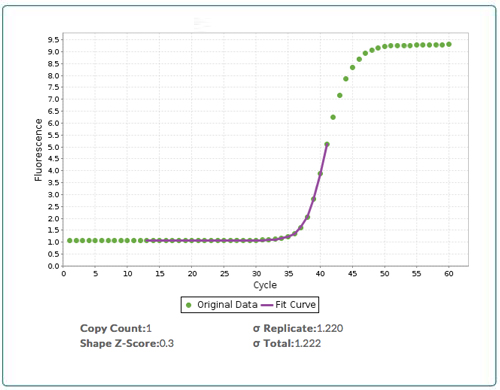
Figure 2: Output from qPCR CopyCount. Raw qPCR data (green boxes) with the fit (purple line) from qPCR CopyCount for a target that has a DNA copy number = 1 at cycle zero (D0). qPCR CopyCount fits the data in the “bend” of the curve.
For optimal results, the fluorescence from a single copy can be determined experimentally by a simple one-time, assay-specific calibration that applies to all instruments and samples and that does not require any standards. In such a calibration, the fluorescence is measured for a single plate of a sample, with the sample diluted to an average of approximately 1.5 copies per well (see Calibration Plate Protocol for more details). For a 384 well plate, this procedure provides a calibration error of lower than 5% for absolute quantification.
If there are no changes in primer design, primer concentration or the master mix, then this assay calibration is sufficient for all future samples. Once such calibration is performed for an assay, then for a single well qPCR CopyCount provides the absolute DNA copy number with a standard error of lower than 5% for absolute calibration.
Absolute Quantification Accuracy
Some applications, such as gene expression analysis, require that the relative amount of two genes is compared, but do not require high absolute accuracy. For these applications, qPCR CopyCount can predict the single-copy fluorescence without any calibration, resulting in an absolute quantification accuracy of approximately 20% and a relative quantification accuracy of 1-5% for a single well and a lower error if replicates are performed.
Table 1 compares the features in cPCR to the features in three other DNA quantification methods -Digital PCR, Standard Curve, and Delta CT.
| Feature | cPCR | Digital PCR | Standard Curve | Delta CT Method |
|---|---|---|---|---|
| Relative Quantification | ✓ | ✓ | ✓ | ✓ |
| Absolute Quantification | ✓ | ✓ | ✓ | |
| No Standards | ✓ | ✓ | ||
| Not Corrupted by low efficiency | ✓ | ✓ | ||
| No Gene Normalization | ✓ | ✓ | ||
| Error Analysis included | ✓ | ✓ | ||
| No specialized equipment | ✓ | ✓ | ✓ | |
| High throughput | ✓ | ✓ | ||
| Low Replicates | ✓ | ✓ | ✓ | |
| No Dilution Series | ✔ |
Table 1: Feature comparison for cPCR versus Digital PCR, Standard Curve, and Delta CTmethods.
Because cPCR uses standard qPCR instrumentation and requires a far fewer number of replicates, cPCR has higher throughput than digital PCR. Also, unlike digital PCR, cPCR works with native samples without the need for sample dilution, which simplifies sample preparation.
No Special Equipment Needed
Moreover, cPCR does not require any special equipment. As a result, you can quickly incorporate cPCR into your existing analysis pipeline with minimal changes in your protocols and you can use cPCR to carry out meta-analysis studies of archived data sets. Unlike the Standard Curve method and the Delta CT method, cPCR does not require standards, dilution series, elaborate gene normalizations, or corrections for different PCR efficiencies.
Thorough Error Analysis
Finally, cPCR includes thorough error analysis, which is useful interpreting data in situations where the qPCR data are unreliable because of poor data acquisition or poor primer design.
Table 2 summarizes some of the applications that are suitable for cPCR analysis as compared to digital PCR. Because cPCR has a much higher throughput than digital, cPCR is appropriate for applications that require high-throughput such as viral load, fragment library quantification for next generation sequencing, and non-invasive detection methods.
| Application | cPCR | Digital PCR |
|---|---|---|
| High-throughput Viral Titer | ✓ | |
| NGS: Fragment Library Quantification | ✓ | |
| Non-invasive Detection Methods | ✓ | ✓ |
| Copy Number Variation | ✓ | ✓ |
| Meta Analysis of Archived Data Sets | ✓ |
Table 2: Comparison of scientific applications of cPCR vs. Digital PCR.
Case Study: GAPDH Dilution Series
Figure 3 illustrates the power of qPCR CopyCount with a single housekeeping gene, GAPDH (glyceraldehyde phosphate dehydrogenase). These experiments were performed at Fluidigm Corporation using their BioMark™ HD System with the Dynamic Array™ IFC 96×96 chip capable of 9216 simultaneous 6.7 nL PCR reactions. A series of 72 replicates of 15 dilutions (3-fold dilution each) were performed for a total of 1080 qPCR reactions on the chip.
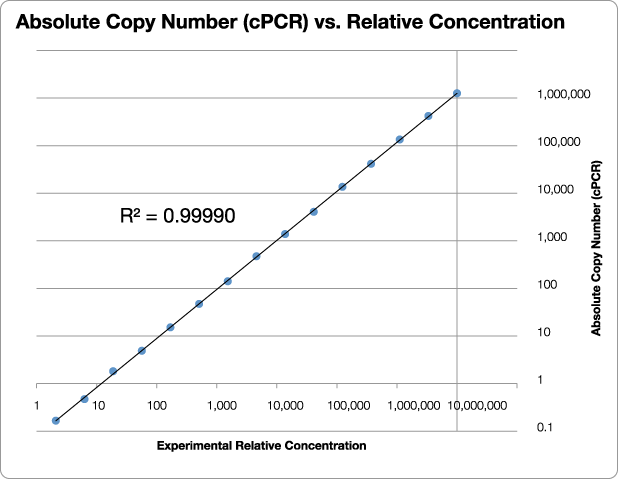
Figure 3: Results from a blind test of qPCR CopyCount vs. the experimental relative concentration for GAPDH. Note the outstanding linearity (R2 = 0.99990) over more than 4 million fold range in concentration. Data provided courtesy of Dr. Gang Sun, Fluidigm Corporation.
Conclusion
Counting PCR (cPCR) is a quantum leap forward in our understanding of qPCR. The principle of cPCR has been incorporated into the revolutionary software product qPCR CopyCount, which provides highly reliable absolute qPCR quantification. qPCR CopyCount saves you money – you can use your existing qPCR instruments (no special equipment is required), and it requires a far fewer number of replicates than digital PCR. More of your plate real estate can be used for samples rather than controls and standards.
Copycount Saves Time
qPCR CopyCount saves you time – you get your results faster because of the high throughput of cPCR and because cPCR requires no dilution series or laborious preparation of quantification standards.
Finally, qPCR CopyCount saves you effort – your bottleneck in qPCR analysis will be reduced dramatically because you will no longer have to carry out intensive manual calculations to correct for differences in PCR efficiency, performing complex gene normalization, and to correct for the effects of PCR data acquired with different instruments, PCR buffers, and protocols.
The absolute quantification from qPCR CopyCount allows for easy comparison of results from different samples, different targets, and different laboratories. This breakthrough in understanding the mechanism of qPCR will have significant implications for DNA-based applications.
1Patent pending. Boggy, G. J. & Woolf, P.J. (2010). “A mechanistic model of PCR for accurate quantification of quantitative PCR data.” PLoS ONE5(8): 355.
Quick Guide to the Precision and Accuracy of results from qPCR CopyCount
Purpose: This Quick Guide to the Output provides you with the basic description of QRT PCR data analysis and how to interpret the output results from qPCR CopyCount.
Summary: An understanding of the difference between precision and accuracy is critical to interpreting the results from qPCR CopyCount. The three most important metrics to understand are σRelative, σCalibration, and σAbsolute. Respectively, these three metrics correspond to the precision (i.e. for relative quantification), the systematic error, and accuracy (i.e. for absolute quantification) of the DNA copy count.
Introduction to Accuracy vs. Precision:
To illustrate the fundamental difference between accuracy and precision, the analogy to a shooting target is instructive (Figure 1). The far left panel of Figure 1 shows the case of a rifle with calibrated sighting scope in the hands of a professional marksman with a steady hand. The middle left panel is the result for a professional marksman using a rifle whose sighting scope is not calibrated. The middle right panel is the result for an amateur (with a shaky hand) using a calibrated rifle. The far right panel is for an amateur shooting an un-calibrated rifle.
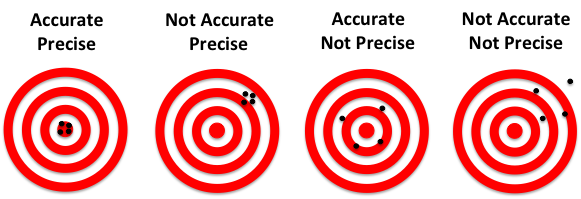
Figure 1: Illustration of accuracy vs. precision using a shooting target.
In this analogy, each shot of the rifle corresponds to a single qPCR reaction. The σRelative is a measure of precision or random error. σCalibration is a measure of the systematic error or accuracy. The σAbsolute is the total error that results from both σRelative and σCailbration. Factors that contribute to σRelative include the Poisson sampling error (described below), pipetting errors in the amounts of target and other reagents, and noise in the qPCR data. Averaging the replicates reduces the random error and results in a smaller σRelative., which represents the standard error of the mean for the replicate set. The more replicates that are performed, the smaller theσRelative. The σCalibration can be improved by performing a calibration plate with more replicates and using the proper mean copy number.
Best Practices:
- For your samples (i.e. unknowns), perform as many replicates as possible to decrease the relative error.
- Calibrate your pipettes and use good pipetting technique to reduce the random and systematic errors (improves both relative and absolute quantification).
- Performing a calibration plate with as many replicates as possible is highly recommended. Keep in mind that the calibration plate only needs to be performed once for each assay design and is instrument and sample independent and never needs to be repeated. Thus it is best to perform many replicates for the calibration plate and then all subsequent Copy Counts will have the highest possible accuracy.Note: If you do not perform a calibration plate, then the copy count results are still highly precise and thus reliable for relative quantification, but the absolute quantification inaccuracy will be within 20-30%, and in rare circumstances could be substantially larger than this.
Basic Error Analysis:
About replicates.
Performing replicate PCR experiments allows the calculation of the standard deviation among those replicates:
where N is the number of replicates, μ is the average copy count of the replicates, and CCi is the copy count number for well i. The σReplicate represents the expected error for a single qPCR well. The Poisson sampling error is given by the square root of the copy count. Thus, if the mean copy count is small (less than 400 copies), then the Poisson sampling error is the dominant contribution to the σReplicate. Such Poisson error occurs even if the user pipettes perfectly.
The average or mean, is significantly more reliable than a single measurement. The standard error in the mean, σMean (also called σRelative), is given by:
Thus, performing more replicates can dramatically reduce the error in the mean (i.e. σRelative). For example, performing 16 replicates results in 4-fold smaller error than a single qPCR reaction.
The coefficient of variation, CV, is the ratio of the error divided by the mean. Thus, the CVRelativeis given by:
![]()
The absolute error is the combination of the relative error and the calibration error as follows:
![]()
Table 1 illustrates the effects of different combinations of calibration and relative errors. Note the absolute errors are dramatically smaller for calibrated assays than for uncalibrated assays.
| Case | CVCalibration | CVRelative | CVAbsolute |
|---|---|---|---|
| Accurate & Precise | 0.03 | 0.01 | 0.032 |
| Inaccurate & Precise | 0.20 | 0.01 | 0.200 |
| Accurate & Imprecise | 0.03 | 0.04 | 0.050 |
| Inaccurate & Imprecise | 0.20 | 0.04 | 0.204 |
Table 1: Effect of different Calibration and Relative errors on Absolute Error from Eqn 4.
Notes: Errors shown are typical for if the calibration plate has 384 wells (i.e. CVCalibration = 3%) and 16 replicates (CVRelative = 1%) are performed on the unknowns. Assays that are uncalibrated are assumed to have 20% calibration error. A sample with only a single replicate (imprecise) are assumed to have 4% relative error.
Two-step Assay Calibration Procedure for TaqMan Assays
Introduction
The following procedure is performed on each new qPCR assay that will be analyzed by qPCR CopyCount. The method is called “2-step” because it involves two qPCR reactions: one preliminary PCR with 4 replicates to get a rough concentration, and one full plate of PCR reactions to get the precise TaqMan assay calibration. This method is faster, more accurate, and more reliable than a dilution series with standards. The calibration needs to be performed only once on each new assay design – the same calibration will work on any instrument and with any sample and will never need to be redone as long as the primers are not redesigned, the primer and probe concentrations are not changed, and the PCR buffer components (i.e. [NTPs], [Mg], and [Enzyme]) are not changed. Thus, it is best to perform the calibration once with as many replicates as possible so that the assay can be used in the future with optimal accuracy.
Background Concept
Read the document: Quick Guide Precision vs. Accuracy of qPCR CopyCount. This provides a brief description of the role of calibration to improve absolute quantification.
Outcome
The calibration error, σcalibrationdepends upon the number of replicates and the mean copy number among the replicates. A 384-well calibration of an assay will provide σcalibration of about 5% inaccuracy if the mean copy number per well is 1.5. For a 96 well plate, the calibration errors will be twice as large as from a 384 well plate. Below is the equation for calculating the approximate calibration error:
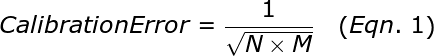
where N is the number of replicates and M is the average copy number per well. Note that for technical reasons, it is not advisable to go above a copy number of 2.5 in performing your calibration plate. Thus, to give a little safety margin, we recommend that you use a mean copy number of about 1.5 for the calibration plate. We also strongly recommended that you use a calibration plate with as many replicates as possible so that error is minimized.
Laboratory Protocol
Note:If you know your initial DNA concentration very accurately (within 25% error), then you can skip step 1 and go directly to step 2.
Step 1A -Initial PCR
This protocol is written assuming 20 μL qPCR reactions. If your instrument uses a different volume, then scale the amounts of target and other reagents such as master mix and primers and probes accordingly. Prepare a 10 μL sample, labeled “Target DNA”, that contains between 1,000 and 100,000,000 copies of Target DNA (no need to be wasteful here, we just need at least 1000 molecules for the entire calibration procedure). Add 2 μL of the target DNA to a centrifuge tube labeled “reaction mix”. Add to the “reaction mix” tube 50 μL of 2X master mix (or 10 μL of 10X master mix) and appropriate volumes of primers and probe. Add water to make the final volume = 100 μL, which is sufficient for 5 PCR reactions, but only 4 PCR reactions will be run. Mix well and pipette 20 μL of the resulting mix into each of four reaction wells in the qPCR plate. The excess ~20 μL can be discarded (100 μL of reaction mix was prepared to be sure that there is enough for the 4 reactions to get a full 20 μL).
Step 1B – Obtain Estimated Copy Count
Run qPCR CopyCount on the four qPCR reactions from step 1A. This will give a rough estimate of the copy count, CC. Average the CC for the four replicates. This estimate provides the DNA copy number to within ±25% as long as your PCR reaction conforms to the limitations for cPCR.
Step 2A – Prepare Calibration Plate
The goal of this step is to prepare a PCR reaction sufficient for 400 wells that each contain about 1.5 molecules of DNA on average (so a total or 600 target molecules are needed). Compute the total molecules that remain in the 8 uL Target DNA sample from step 1A. This is accomplished using the copy count, CC, from step 1B as follows:
![]()
where the factor of 20 is because the remaining Target sample has 4-fold as much DNA in 8 μL compared to 2 μL, and that was effectively split into 5 reactions worth of volume in step 1A. From the total from Eqn. 2, compute the volume that contains 600 molecules. For example, if the Total = 1352 molecules then the volume needed is:

Note that the volume used does not need to be perfectly exact (for example if you pipetted 3.5 μL that would be fine), the number of molecules could be off by a few percent and that will have no effect on the calibration. If the volume computed with Eqn. 3 is too small (like 0.01 μL), then you will need to first dilute the sample by adding water, and then pipetting out the amount needed taking into account the added dilution. Pipette the volume needed from Eqn. 3 into a fresh 20 mL tube labeled “Calibration Reaction Mix”. Since we are preparing reaction mixture for 400 reactions with 20 μL each, the total reaction volume is 8000 μL. Add to the “calibration reaction mix” tube 800 μL of 10X qPCR components (master mix, primers and probe) and add water to make the final volume = 8000 μL, which is sufficient for 400 PCR reactions, but only 384 PCR reactions will be run.
Notes:
- It is essential to acquire a sufficient number of PCR cycles to allow for saturation to be observed. We suggest 60 cycles for 10-20 μL reaction volumes (if your volume is much smaller, like 33 nL, then fewer cycles can be used as long as full saturation is observed even for a single copy of DNA at cycle zero).
- We recommend that the PCR extension time is 1 minute to ensure that all amplicons are fully extended.
Step 2B – Run Your Calibration Plate
Run qPCR CopyCount and select “Calibration Plate”. Upload the data from step 2A, and give a name for the assay that you are calibrating. The program will do the rest. The calibration for that assay will be saved to your database of assays so that you can use it for sample unknowns in the future.
Notes:
- Rarely, some assays may be very poorly designed resulting in aberrant behavior. If your calibration produces a message “Calibration plate unreliable due to poor Chi-squared P”, this is an indication that your assay is poorly designed (e.g. the primers are highly inefficient due to competing secondary structure) or that there is some other problem with the PCR, such as very bad contamination or poor reagent quality.
- If your estimated copy count in step 1B is incorrect by more than a factor of 2, then you will get the message: “Calibration plate unreliable due to high copy number”. This means that you will need to further dilute your sample (we recommend diluting by 2- to 3-fold more) and run a new calibration plate.
Quick Start Guide for qPCR CopyCount
Purpose: This CopyCount Quick Start Guide provides the basic information and best practices for running qPCR CopyCount.
Best practices for setting up your qPCR plate
- We recommend that each sample be run with at least 4 replicates. This allows for outliers to be detected and for averaging to improve the quality of your results.
- It is best to set up your plate with many different samples and replicates but only a few different assays. We recommend that each 96-well plate contain no more than 4 different assays. Larger plate formats can accommodate more assays.
- Perhaps the largest contributor to reducing error is the quality of pipetting. Minimizing random and systematic errors in pipetting is essential to obtaining high quality results. If you are not already familiar with these concepts, please review forward pipetting, reverse pipetting, repetitive pipetting, heterogeneous pipetting, and pipette calibration.
What you need before running qPCR CopyCount
- Export the raw data file (in .xls, .xslx, .csv, .txt or .tsv formats ) that contains the fluorescence and cycle-number information. Note that it is very important to submit raw data, not smoothed data (smoothing changes the shape of the qPCR curve and thus corrupts that determination of the copy count).
- What is the layout of samples, replicates and assays on your plate? Please see definitions below.
- What is your qPCR reaction volume?
- Are your target DNAs or RNAs single stranded or double stranded?
- What are the names of the assays that are present on your plate?
- Has your assay been previously calibrated?
Advantages of qPCR CopyCount
- Every qPCR well is now an absolute qPCR.
- No dilution series required
- No internal or external calibration standards
- Results are instrument independent and fluorophore independent.
- Archived qPCR datasets can be analyzed, which enables meta-analysis.
- cPCR can use TaqMan Probes or Duplex Binding Dyes (however, duplex binding dyes are susceptible to non-specific amplification artifacts).
Limitations of qPCR CopyCount
- Must use Hot Start PCR to minimize premature amplification and also delayed onset PCR.
- Will not work with circular plasmid targets (linear plasmids are OK)
- Will not work with unsheared genomic DNA targets (but does work with sheared genomic DNA).
- Currently does not work for asymmetric PCR or certain other primer strategies (such as castPCR™, or myT®primers, or competimer™).
- Getting best results (absolute quantification accuracy of 5% for a single well) requires one-time calibration for each new assay design (i.e. primer set and master mix).
- Cannot be applied to end-point PCR data
Definitions
Sample: The sample is the biological specimen (human, animal, plant, environment, or other) that contains the target nucleic acid intended for quantification. Typically, the same assay (defined below) will be run on many different samples. The number of assays, samples, and replicates can vary, so please follow the equation below to determine the total number of wells.
Total Wells = Samples x Replicates x Assays
Replicate Set: If two or more wells contain the same sample and the same assay, then those wells form a “replicate set.” Typically, 4 to 96 replicates are run on each sample. The program needs this information to assign which wells should be averaged. Essentially, more replicates means lower error bars.
Why this is important: These replicate sets tell the program which wells should be averaged together to calculate the “Mean Copy Number.” Every well must have assigned to it an assay name and a replicate set name. It is important that the user declare to the program the replicates that correspond to the plate layout that was actually performed. If a well is not declared in any replicate set, then it will be ignored by the program and no copy number will be produced for such undeclared wells. Unused wells should not be declared. Wells with no template controls (NTC) should be declared as a separate replicate set so that the program will appropriately analyze NTCs to determine if any of those wells unexpectedly contain target DNA (i.e. false positives).
Assay: If two qPCR reactions have either a different set of primers or a different master mix, then those reactions are considered to be different assays. A typical qPCR plate will have 1 to 4 different assays. The user needs to provide some information about the assay: is the target double stranded, [primer], [probe], amplicon length, and whether the probe contains an MGB. Each replicate set must have an associated assay name.
Why this is important: qPCR CopyCount uses the assay information to do proper fitting of the curves. If you provide wrong information, it will affect the accuracy of the results.